Tuesday, December 31, 2013

December 2013 Racing and Training Summary

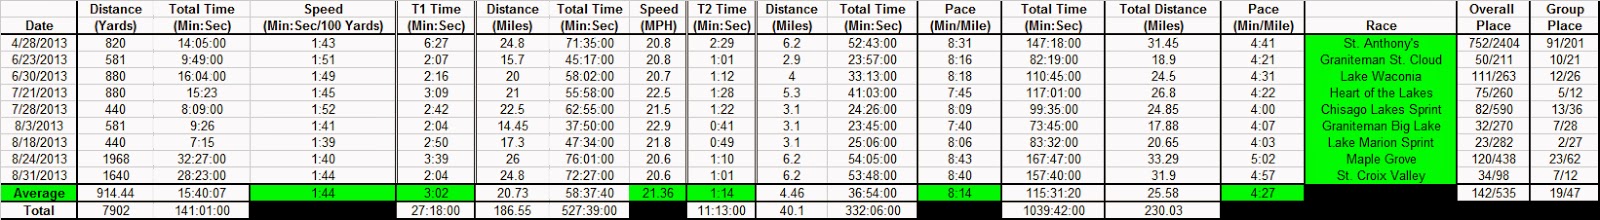
Below is my usual training comparison for December.  No racing this month.  It was an above average December.
In January I will have to work on ramping it up above 20 hours.  I would like to be above 22 hours, with 8+ hours on the bike.
Today, the last day of December, I shoveled, then spin bike for 75 minutes, and then run on treadmill for 60 minutes.  In that order.  The long workout felt pretty good.  I just wanted to see where I was at, at the end of the year.  The 75 minute bike was a ramp up for 20 minutes, then alternate kind of hard for 5 minutes and then back off for 5 minutes.  I got off the bike and on the treadmill and ran the first mile as hard as I could, 7:45/mile.  Then every mile I alternated between hard and easier, easier no slower than 8:34/mile.  I wanted to run a 10K under 50 minutes, and I was able to go 49:45.  The last 10 minutes was a warm down.  I felt stiff getting off the treadmill.  I am probably going to be feeling it tomorrow.
This December the totals were greater than last two Decembers.  I biked and ran a little less than usual.  This December was a little different than previous Decembers, since we closed on a house and moved into a house.  Even with that I was able to get in some decent workouts.  I kept up my swimming this year, as I had planned to do.  My increased swimming from last year, and keeping up strength workout, made up the difference from previous years.
Off to start 2014.  My next post will compare totals from previous years and then post about my weight, as usual.


December-to-December Comparison


Totals and Averages Since 2007


YTD Totals and Since 2007


Tuesday, December 24, 2013

Kiefer Performer Swim Goggles - Product ReReview (Originally Product Review 27)

Back in January of this year I received a pair of Kiefer Performer Swim Goggles, from Kiefer, to review.  At the time I wrote up a little something about them.

My original post is here: http://nowiamdoingsomething.blogspot.com/2013/01/product-review-27-kiefer-performer-swim.html
The goggles are here: www.kiefer.com

I have used the pair they gave me for the whole year.  The only thing I did was replace the strap, because I accidentally ran the goggles through the washer and dryer and destroyed the strap.  I used a bungee cord type strap that worked fantastic.
Now that almost a year has gone by I wanted to comment on these goggles.
I used the goggles all year, both racing and training.  Amazingly, I did not lose them.  I have put about 250,000 yards on the goggles this season.
Also, they lasted the whole year without leaking, until about 2 weeks ago.  About two weeks ago they started to leak a bit.  Last week I ordered two more pair of the same goggles. 
These goggles are great for the price, and just in general.  They are 12 bucks a pair, about half the cost of the Speedo Air Seal Tri Mirror I had been wearing previously.  The Speedo goggles would last about as long.
Goggles are a purely personal choice.  Everyone has different size heads, different facial features, etc. that will affect how goggles fit.  Sometimes it takes years to find goggles that work well for a person.  If not years, then lots of money trying different goggles.  Luckily, I kind of fell into these goggles.
So, if you are out looking for goggles, I would recommend giving these a try. 

Monday, December 23, 2013

Race Totals Since 2006 (All Races) and Some Statistics

Since 2006 I have completed 178 individual races.  The breakdown by race type is in the table below
Triathlon = 66
Duathlon = 28
Running Races = 35
Time Trials = 45
Cycle Cross = 4

Race Count Table


My biggest triathlon years were 2008 and 2010 and my biggest duathlon years were 2006, first year racing, and 2007.  There are a number of years that I did 5 or more TTs.  My biggest run race year was 2006, when I started doing duathlons.  I replaced run only with duathlons, triathlons, and TTs, which makes sense.  This year I did do 7 run only events, which is the most since 2006.

I also added a chart to breakdown the races by month, just to get an idea of which months are the busiest and what type of races I do each month.  Being in MN it makes sense the busiest race months are going to be June - August.  June looks like the busiest overall.  Most duathlon are in May and September.  Most triathlons are in July.

Month-to-Month Race Count Comparison


I took the total distance I raced each distance, and the total time spent racing each distance, and then divided the two to see my average speed\pace at each.  By my estimate I have raced over 3500 miles and spent over 230 hours racing those 3500 miles.  I have spent over 1700 hours racing and training,so I have trained about 1500 hours.  The ratio of the time I spend racing to training is about 1:6.5, so for every hour I spend racing, I spend 6.5 hours training.  Kind of an interesting statistic.
My average 100 yd pace is 1:45, my average bike speed is 21.4MPH, and my average run pace is 8:31/mi.

Table of Total Time and Distance Racing, with Pace\Speed


I will post my total racing and training time for the year at the beginning of 2014, along with comparisons of totals for previous years.


Friday, December 13, 2013

November 2013 Racing and Training Summary

I am running a little late with this.  Busy, busy, busy.  Just closed and moved into a new house, so that is taking up some time that would normally be free for other things.  It is worth it.  The house is awesome.  We are setting up a training room in the house.  Basically, a room to put a bike trainer, maybe a treadmill someday, a place to store workout and race stuff, workout mats, with a TV and DVD player.
I did a 5K on Thanksgiving, in St. Paul, down by the river.  It was cold and it went ok.
5K = 23:47 (7:40/mi)

I got more swimming in this December than the previous two years.  Again, Masters is an ass kicker.  Run time down a little from previous years, bike time up from last year, and strength time down from last year.  Overall, my strength work for this year is the highest it has been since 2009 when I had the stress fracture.

In December I am going to workout when I can.  It is tough month with the holidays, and especially with moving into a new house.  I will see what I can do. 
In January I will have to start ramping up.  I have registered for two races already.  St. Anthony's in St. Petersburg, FL.  2014 will be the 7th time there.  The other race I registered for is Lake Minnetonka.  Once 2014 starts, I will probably start registering for more.  2014 here I come!


November Year-to-Year Comparison


Workout Totals and Average Since 2007


YTD and Totals Since 2007
 

Friday, November 29, 2013

Analysis of Run Performance Since 2006 - Comparison of Training Data to Race Results

This post is a look at my run data since 2006.  Unfortunately, like the bike, I only have full run data from 2007, only results from 2006.  In 2009, as I have mentioned in the past, I had a bad stress fracture and basically did not run for 6 months of that year, and the beginning of 2010.  So, I have no data for 2009.
Since 2009, I have been hesitant to run as much or as hard as I did prior to the stress fracture.  I am sure that this is part of the reason for my slower times since 2008. 
Near the end of 2012, I have began to do my training faster, and I have done longer training workouts in 2013.  I think I am getting over my fear of re-injuring my leg.  I have been hesitant in training to go as faster or as far as I require to go faster, but that changed in 2013.
So the plan was to go longer and faster in 2013, with the hope I can improve my run speed to 2008 times, or faster results.  In 2008, I ran my fastest 5K (22:33 = 7:16min/mi), 10K (46:36 = 7:31min/mi), 2mi (12:58 = 6:29min/mi), and 8K (36:40 = 7:20min/mi), in 2009 before stopping due to stress fracture.  I have not been close to those times since then. 
In 2013 I ran an open 5K at 22:06 (7:08/mi), my 8K time was 38:10 (7:41/mi), and 2 mi was 14:29 (7:15/mi).  I did not run an open 10K.  So, I was able to put together a fastest 5k in many years, and the 8K was the fastest since 2009, run with my stress fracture.
2006 is heavily weighted with open runs (11) and duathlons (5).  I have done less and less open runs since then and more and more duathlons and triathlons.  This year I did more open runs than previously, two 5Ks, four trail races, and an 8k.
The larger range in 2008 is due to my slow run time at Alcatraz and the 70.3 I did that year.  The large range in 2010 is due to the two half-IMs I did.  My average in 2010 is depressed due to the fact I took it easier in the first few races of the year as I came back from injury. 2011-2013 I did only sprint and olympic distance, so the shorter distances kept the range tighter
The data in the table and graphs is in Seconds/Mile, rather than Minutes/Mile because it is easier to graph in Excel.
The graph of comparing total training time to fastest speed and average speed shows no real correlation between the two.
Based on the graph comparing total run time to fastest and average, an argument can be made that more time is better.  The problem is one data point is at the high end and the rest are at the low end.  I have that group around 60 hours and my times are about the same.  It would be interesting to get back around 90 hours, but I would be afraid I might do some damage to my leg(s) again. In 2014, I hope to continue similar to 2013.  Keep in the 60+ hour range for the 12 month period, do some longer runs, over an hour, and more speed work.  I think in 2013 I did a better job with speed work and getting in some runs that were around an hour.

Run Data Table


Comparison of Run Training Time to Average Run Race Pace


Comparison of Run Training Time to Fastest Run Race Pace


Comparison of Total Training Time to Average Run Race Pace


Comparison of Total Training Time to Fastest Run Race Pace


Analysis of Bike Performance Since 2006 - Comparison of Training to Bike Race Speed

This is the second of three posts were I will compare my training to my race performance.  I previously posted my swim analysis.

I have compiled my bike data since 2007, to look at my performance compared to my training time.  I have results for 2006, but no training data.  I did not start tracking training data until 2007, which is unfortunate, since it would be nice to have training data from the start to compare performance data from the start.

I compiled all the bike speed data (TT, triathlon, and duathlon) and put that in a table with bike training time data and total training time data.  The table and all charts below are data from October to October, except 2007 which is Jan-Sept, since I have no data from 2006.  At the end of the year I put out my calendar year training data.
Click on the table enlarge. 

Bike Data Table
 
My slowest bike speed for any given year does not vary much from year-to-year. Slowest time, 2008, was from Escape from Alcatraz, very steep, hilly course. Also, I was probably doing too much sight-seeing while riding. In reality, my bike data does not vary much from year-to-year, it is pretty flat. If you throw out my slowest from 2008 and take my next slowest, my range would be about 3mph for each year, except 2006 and 2008.
In 2006, my average bike speed is about 19MPH. I basically flattened out after 2008, averaging about 21.5MPH.  After my injury in 2009, I also stopped paying for a coach in that year, I have not shown much improvement since then.  I improved from 2006 to 2008. During that time the volume and intensity went up dramatically.
If you look at the data, I can train about 90+hours over the 12 month period, at the effort I am putting in, and stay consistent.  The three years that I trained, and raced, the most 2008, 2010, and 2011, I had the fastest bike.  2008 had less bike than the other two, but it had a lot more running and swimming.
Also note, in 2006 I was riding a Lemond Sarthe road bike with clip-on aero bars and no race wheels.  Starting in 2007, I raced with a tri-bike and race wheels.  Also, 2006 is duathlons and TTs, no triathlons.
In 2013, my fastest, slowest, and average are all about the same as 2012.  I was not able to get over the 23MPH "hump".  I put in about the same bike time in the 12 month period, Oct 2012 to Oct 2013.  I think I transferred a lot of my hard effort this last year into running and swimming, and did not put in the hard bike I had put in previous years.  Hopefully, in 2014 I can get in more spin classes, which I think will help my speed.
I think I also need a refit on both my bikes.  I had some nagging hip soreness after some of my races, and bike workouts.  I think something has changed with me.

Select any of the tables below to enlarge. 

Total Bike Training Time Compared to Average Bike Race Speed


Total Bike Training Time Compared to Fastest Bike Race Speed


Total Training Time Compared to Average Bike Race Speed


Total Training Time Compared to Fastest Bike Race Speed


When comparing my total training time, or bike training time, to average or fastest, the data points trend the same.  So, no real correlation between the two, or they are directly correlated, but there does not appear to be a negative correlation between my total training time and bike speed.
As long as I am doing only duathlons, sprint triathlons, and olympic distance triathlons I can stick to the 70-100 hours.  If I do a 70.3, or longer (IM not going to happen), I would need to increase my training time.  To improve my speed, I will have to, have to, increase my output.  I will have to train harder, not longer.  I know over the last two years I have not put as much effort into training, even though I have put in the time. So, to improve that max speed and average speed I need to train harder.  It has been said many times, "You need to train faster to go faster".  This is something we all know, and I know, it just needs to be put into action.  Ideally, in the 12 month period I would train over 100 hours and have structured speed work.

Wednesday, November 27, 2013

Yearly Analysis of Swim Performance Since 2007 - Comparison of Performance to Training

I (re)started swimming in 2007, after not swimming since high school. I did duathlons in 2006 and then decided to try triathlons in 2007, so I started swimming in March 2007. 
I hired a coach in 2008 and got swim workouts that I did on my own, typically 3 days a week. I started Masters in early 2009, typically 3 days a week.  You can see significant yardage jumps from 2007 to 2008, and I have more or less maintained that yardage since then.  Something of a spike in 2009 and 2010, when I swam more due to my stress fracture.
In 2013, I continue to swim in the same pool I have swam in since 2009, but with a new Master's coach. 
I have shown improvement with time, but more or less flattened out.  Since the swim distance on swim courses is somewhat suspect, it is hard to determine really how fast you are going.  The only true test of improvement and how fast you are is in the pool, with a certified distance and controlled conditions. 
Some of the swims in triathlons have the timing mat immediately out of the water, some you have a decent run up before you get to it, so that is added into your time. 
I do know that when I started, it was 2+ minutes for a 100s in a set.  Now I am more in the area of 1:20-1:30, sometimes faster.  My fastest off the block, which was last spring was a 1:06, and my fastest 200, in water start, was a 2:44, which was this summer. 
I definitely think that my stroke has gotten better and I have gotten faster.  Even though my race times do not reflect the fact that I have gotten faster.  Still, I do not think I am aggressive enough in the open water.
Below is the data table.  The table in the charts are data from October to October.  My times in the table and the charts are in seconds/100yards because it is easier to plot.  The unusually fast time in 2011 is the Twin Cities Triathlon swim in the Mississippi.  In 2009, I only did two races, the reason for the narrow range, one was a relay triathlon and one was a sprint triathlon, where I walked the run.
There is a huge jump in yardage and time as I go from swimming on my own, to getting coached workouts, to going to Masters, and my race pace improves, and then there is flattening out.  I know, for sure, I have gotten faster in the pool over the last two years, especially this year.  It has not translated to my open water swimming.  Again, I am pretty sure this has more to do with how aggressive I swim, not with my level of physical fitness.  I have to be more aggressive.  I think, I know, I have the fitness and ability to swim faster in races.
My fastest race times are probably the 1:24/100yards - 1:29/100yards.
In 2013, it shows me swimming less from Oct 2012 - Oct 2013, because I took some time off from Oct 2012 - Dec 2012, and a little less in Jan 2013.  My totals for 2013, from Jan-Dec, will beat the same time period from 2012, and probably be the 3rd most yardage, and time, I have put in.  Oct 2013 - Oct 2014 will be pretty high in yards and time.  The new Masters I am in works me much harder than previous years.  I think the increased yardage this year, has helped my overall fitness, and the stroke work has helped my overall swim.
I have said it once, I have said it a thousand times, and I will say it again.  As a beginning triathlete, the best thing you can do is swim a lot and get conditioned in the swim.  I have heard/seen, so many beginning triathletes say they will just "get through the swim", barely do any swim training, do all bike and run, and then get to race day and have a bad/horrible swim, and up having the rest of the race be difficult because of it.  When the swim is comfortable, in the sense you can do it and it is not stressful, and you are conditioned for it, the whole race is "easier".

Swim Data Table


Comparison of Total Hours Swimming to Average Race Pace for that Year


Comparison of Total Yards Swimming to Average Race Pace for that Year


Comparison of Total Hours Training to Average Race Pace for that Year


Comparison of Total Yards Swimming to Fastest Race Pace for that Year


Comparison of Total Hours Swimming to Fastest Race Pace for that Year


Saturday, November 16, 2013

Review of my 2013 Duathlon Results and Past Duathlon Results

Three duathlons this year. Gear West at the beginning and Dousman at the end, and the accidental duathlon in June.  Manitou Sprint Tri turned into a duathlon because of bad weather.  It was probably some of the worst weather I have ever raced in.  The runs felt pretty good, but the bike was horrible.  Battering wind and rain.  Just bad. 
Gear West went ok.  It rained horribly before, and the start was delayed.  My run was slower than previous years, but I am not sure the distance was totally correct.  My GPS had me running a little further than the stated distance.  The course has changed around a little bit the last couple of years.  I did like the course this year.  Bike course was the same as always, and my time was pretty close to years past.  No big breakthrough.  Dousman was a little faster than last year.  I was happy with my race that day.  I would say that my performance this year is pretty average.

Below are my results from this year's races.  Click to enlarge


Below are the charts that compare my year-to-year average duathlon results.  Below the charts is a table of the data.  All pace is in fractions of a minute.  2006-2008, I show improvement in all fronts.  After my injury in 2009, there is a spike in 2010 as I come back from injury.  Basically, last four seasons I am up and down.  I think my times at Manitou Sprint dragged me down on the bike, and my slow runs at GW Du dragged me down on my runs for this year.  For some reason, my T1 average time was much better.  In the end, I was a little slower than my average this year, but around the average.  Again, nothing spectacular, but I did it.
I plan on doing GW Du and Dousman in 2014.  I think I need to do more bike\run and run\bike speed bricks to improve my performance.  GW is always a tough Du.  It is a tough cross country like run course, coupled with a fairly tough bike.  This off season I hope to do more run strength work to prepare for that, and for better running in 2014.

Average First Run Pace Year-to-Year (Lower Pace is Faster\Better)


Average T1 and T2 Times from Year-to-Year


Average Bike Speed from Year-to-Year (Higher is better)


Average Second Run Pace Year-to-Year (Lower Pace is Faster\Better)


Average Overall Pace Year-to-Year (Lower Pace is Faster\Better)


Chart of Averages
 

Thursday, October 31, 2013

October 2013 Racing and Training Summary

In October I did the last two Salomon Autumn Trail Races.  Amazingly, I dropped time in each race.  Even more time in the last two.  All my times are below.  After I did my last multi-sport race in September, Dousman Duathlon, I focused on running and did more lifting.  On the weeks that I did not do a trail race, I did a very hard run on the treadmill.  I would do a mix of hard incline and speed. After, I finished the trail races, I kept doing hard treadmill workouts.  October became something of a "run focus" month.  Not really in terms of the amount of time I spent, more in the intensity of workouts.  
I decide not to cut swimming as much as I did in years past.  This October I swam more than I did last October, November, and December combined.   This is the most I have swam in an October since 2010.  I would like to keep my swim up through the "off-season".  I did more strength training this October than any in the past.  My bike and run were down a little bit from previous years.
My plan of November and December is to increase my time spent on bike, lower run intensity and do longer runs, keep up strength work (maybe even try some crossfit), and keep up the swim.
Being that the holidays are coming up, and it appears my wife and I are buying a house, I think the time I spend training will get cut into.  That is ok, it is for good reason and it is that time of the year.

Salomon Autumn Trail Race Results (All runs 4.2 miles, last two significantly cooler than first two)
9/4 - 37:00 = 8:49/mile
9/18 - 36:25 = 8:41/mile
10/2 - 35:31 = 8:28/mile
10/16 - 34:41 = 8:16/mile

I dropped a total of 2:19 from the total time and my pace improved by over half a minute per mile.  I did all the runs with my oldest, and best, friend Matt.  I think that really helped to have someone to run with and to help push me.  I did the shorter, 3.5 mi, course twice last year, and my best pace was 8:33/mile.  So, it was good to see by the end I was not only faster on this course,  but faster than last year on a longer shorter course.  For comparison, the winning men's times are in the 23-24 minute range.  That is crazy.

Year-to-Year Comparison of Oct Training and Racing Time


Total Time Since 2007 and Average Training and Racing Time


YTD and Total Time Since 2007
 

Saturday, October 19, 2013

Review of 2013 Triathlon Results - Comparison to Previous Years (Charts and Graphs, Oh My!)


My triathlon season is over.  It has been over for over a month now.  Time to take a look back on this year and do a little comparison to years past.
My best race of the year, in terms of feeling good and going fast was Graniteman-Big Lake.  I did not go that fast, and it did not feel like my best race, but Lake Marion Sprint is the race I placed at, and that felt pretty good.
My worst race, was probably Graniteman-St. Cloud.  I didn't feel too great going into it that morning.  Kind of tired and blah.  The weather was crappy, windy, a little cool, drizzly.  I just could not and did not muster it that day.
Fastest bike was at Graniteman-Big Lake.  It felt good too.
My two fastest runs were at Graniteman-Big Lake and Lake Waconia.  Waconia was the most rewarding because the run is 4 miles and it is a challenging run.
All my results for 2013 triathlons are below.  Click on table to enlarge.

2013 Triathlon Results
 
2013 Average Swim Distance and Average Pace = 914 yards and 1:44/100 yards
2013 Average T1 Time = 3:02
2013 Average Bike Distance and Average Bike Speed = 20.73 miles and 21.36MPH
2013 Average T2 Time = 1:14
2013 Average Run Distance and Average Pace = 4.46 miles and 8:14/mi
2013 Average Triathlon Distance and Average Pace (=Total Dist/Total Time) = 25.58 miles and 4:27/mi 
2013 Average Overall Place and Average AG Place = 142 of 535 for overall and 19 of 47 for AG
 
Below are charts that compare my average speed/pace/time for each area of triathlon by year.  Below the charts is a table that contains all the data.  The times are averages of my sprint and Olympic distance races, no half-im distances are included.
Basically, I got faster after 2007, then I missed 2009 with injury, improved a bit in 2010, then kind of leveled off, and in some cases got slower, like the run. 
My increase in performance from 2007 to 2008 was probably due to the large increase in training time and to coaching.
 
Comparison of Average Swim Pace from Year-to-Year (Lower is better)
 
Average Transition Time, T1 and T2 (Lower is better) 
 
Average Bike Speed (Higher is better)
 
Average Run Pace (Lower is better)
 
Average Triathlon Total Pace (Total Race Distance/Total Race Time, Lower is better)
 
I have basically been flat year, over year, since my injury in 2009.  This makes sense, because my training has basically been flat.  By flat I mean, I am putting nearly the same amount of time and effort.  My average pace dropped from last year, and is the lowest it has been, partially due to more shorter sprint triathlons than usual, and last year the horrible race at St. Croix Valley killed my average.  Even though I am swimming as much as ever, and I am faster in the pool, my swim pace in races is basically flat.  I think this is a combination of variations in the actual distances at races, and my level of aggressiveness in races.  I am not a very aggressive swimmer in a race environment.  I should be more aggressive, because I think I am a faster than average swimmer at most triathlons.  My run was better this year than last year, because I spent more time on it.
I will have another post that looks at all of my run and bike data compared to my training data.  Also, a post with my duathlon data.  Below is the chart that corresponds to the above data.  Everything is expressed the same as the charts above.  Swim is in fractions of a minute per 100 yards, T1 and T2 is fractions of a minute, bike is MPH, run is fractions of minutes per mile, and average pace is fractions of a minute per mile.  Table includes averages and standard deviation.
 
 
Below is the time spent swimming, biking, running, in hours, each year up from January through September of that year.  Parenthesis is order of time spent swim, bike, run.
Total Time 2007 = 95 hours (27, 31, 37)
Total Time 2008 = 253.5 hours (80, 89.5, 84 )
Total Time 2009 = 201 hours (93, 83, 25)
Total Time 2010 = 236.5 hours (89.5, 106, 41)
Total Time 2011 = 228.5 hours (78, 102.5, 48)
Total Time 2012 = 189 hours (77, 69, 43)
Total Time 2013 = 188.5 hours (77, 68, 43.5)
Interestingly, my time spent this year and last year are almost identical, but last year I thought I had a much worse year running, and racing overall.  I definitely put in more running effort, harder run workouts, this year than last year.  My time spent on the bike has dropped dramatically in the last two years.  I really, really need to fix that.  Bike time in 2010 was so high because I did two half-IMs.  I think my total time, swimming, biking, running, and strength will be greater for 2013 than in 2012.  I am swimming more in Oct-Dec than I did last year and doing more strength.  I don't know if I will ever get back to the levels of 2008. 
I will have another post at the beginning of 2014 that compares total training time each year to my performance for those years.


Saturday, October 12, 2013

2013 Transition Pictures

Here are pics of all my transitions from 2013.  Try to do this every year.  Interesting to see all the different setups from this year.

St. Anthony's Triathlon


Gear West Duathlon


Manitou Sprint Triathlon (Became Duathlon)


Graniteman - Saint Cloud Sprint Triathlon


Lake Waconia Triathlon

Heart of the Lakes Triathlon 

Chisago Lakes Sprint - No Pics, on phone and did not transfer

Graniteman - Big Lake

Lake Marion Sprint Triathlon


Lifetime Maple Grove - Oly Distance


St. Croix Valley - Olympic Distance

Dousman Duathlon