Thursday, October 31, 2013

October 2013 Racing and Training Summary

In October I did the last two Salomon Autumn Trail Races.  Amazingly, I dropped time in each race.  Even more time in the last two.  All my times are below.  After I did my last multi-sport race in September, Dousman Duathlon, I focused on running and did more lifting.  On the weeks that I did not do a trail race, I did a very hard run on the treadmill.  I would do a mix of hard incline and speed. After, I finished the trail races, I kept doing hard treadmill workouts.  October became something of a "run focus" month.  Not really in terms of the amount of time I spent, more in the intensity of workouts.  
I decide not to cut swimming as much as I did in years past.  This October I swam more than I did last October, November, and December combined.   This is the most I have swam in an October since 2010.  I would like to keep my swim up through the "off-season".  I did more strength training this October than any in the past.  My bike and run were down a little bit from previous years.
My plan of November and December is to increase my time spent on bike, lower run intensity and do longer runs, keep up strength work (maybe even try some crossfit), and keep up the swim.
Being that the holidays are coming up, and it appears my wife and I are buying a house, I think the time I spend training will get cut into.  That is ok, it is for good reason and it is that time of the year.

Salomon Autumn Trail Race Results (All runs 4.2 miles, last two significantly cooler than first two)
9/4 - 37:00 = 8:49/mile
9/18 - 36:25 = 8:41/mile
10/2 - 35:31 = 8:28/mile
10/16 - 34:41 = 8:16/mile

I dropped a total of 2:19 from the total time and my pace improved by over half a minute per mile.  I did all the runs with my oldest, and best, friend Matt.  I think that really helped to have someone to run with and to help push me.  I did the shorter, 3.5 mi, course twice last year, and my best pace was 8:33/mile.  So, it was good to see by the end I was not only faster on this course,  but faster than last year on a longer shorter course.  For comparison, the winning men's times are in the 23-24 minute range.  That is crazy.

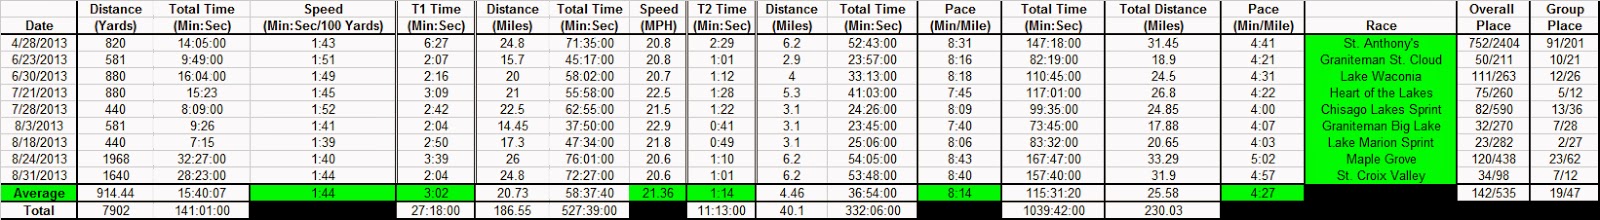
Year-to-Year Comparison of Oct Training and Racing Time


Total Time Since 2007 and Average Training and Racing Time


YTD and Total Time Since 2007
 

Saturday, October 19, 2013

Review of 2013 Triathlon Results - Comparison to Previous Years (Charts and Graphs, Oh My!)


My triathlon season is over.  It has been over for over a month now.  Time to take a look back on this year and do a little comparison to years past.
My best race of the year, in terms of feeling good and going fast was Graniteman-Big Lake.  I did not go that fast, and it did not feel like my best race, but Lake Marion Sprint is the race I placed at, and that felt pretty good.
My worst race, was probably Graniteman-St. Cloud.  I didn't feel too great going into it that morning.  Kind of tired and blah.  The weather was crappy, windy, a little cool, drizzly.  I just could not and did not muster it that day.
Fastest bike was at Graniteman-Big Lake.  It felt good too.
My two fastest runs were at Graniteman-Big Lake and Lake Waconia.  Waconia was the most rewarding because the run is 4 miles and it is a challenging run.
All my results for 2013 triathlons are below.  Click on table to enlarge.

2013 Triathlon Results
 
2013 Average Swim Distance and Average Pace = 914 yards and 1:44/100 yards
2013 Average T1 Time = 3:02
2013 Average Bike Distance and Average Bike Speed = 20.73 miles and 21.36MPH
2013 Average T2 Time = 1:14
2013 Average Run Distance and Average Pace = 4.46 miles and 8:14/mi
2013 Average Triathlon Distance and Average Pace (=Total Dist/Total Time) = 25.58 miles and 4:27/mi 
2013 Average Overall Place and Average AG Place = 142 of 535 for overall and 19 of 47 for AG
 
Below are charts that compare my average speed/pace/time for each area of triathlon by year.  Below the charts is a table that contains all the data.  The times are averages of my sprint and Olympic distance races, no half-im distances are included.
Basically, I got faster after 2007, then I missed 2009 with injury, improved a bit in 2010, then kind of leveled off, and in some cases got slower, like the run. 
My increase in performance from 2007 to 2008 was probably due to the large increase in training time and to coaching.
 
Comparison of Average Swim Pace from Year-to-Year (Lower is better)
 
Average Transition Time, T1 and T2 (Lower is better) 
 
Average Bike Speed (Higher is better)
 
Average Run Pace (Lower is better)
 
Average Triathlon Total Pace (Total Race Distance/Total Race Time, Lower is better)
 
I have basically been flat year, over year, since my injury in 2009.  This makes sense, because my training has basically been flat.  By flat I mean, I am putting nearly the same amount of time and effort.  My average pace dropped from last year, and is the lowest it has been, partially due to more shorter sprint triathlons than usual, and last year the horrible race at St. Croix Valley killed my average.  Even though I am swimming as much as ever, and I am faster in the pool, my swim pace in races is basically flat.  I think this is a combination of variations in the actual distances at races, and my level of aggressiveness in races.  I am not a very aggressive swimmer in a race environment.  I should be more aggressive, because I think I am a faster than average swimmer at most triathlons.  My run was better this year than last year, because I spent more time on it.
I will have another post that looks at all of my run and bike data compared to my training data.  Also, a post with my duathlon data.  Below is the chart that corresponds to the above data.  Everything is expressed the same as the charts above.  Swim is in fractions of a minute per 100 yards, T1 and T2 is fractions of a minute, bike is MPH, run is fractions of minutes per mile, and average pace is fractions of a minute per mile.  Table includes averages and standard deviation.
 
 
Below is the time spent swimming, biking, running, in hours, each year up from January through September of that year.  Parenthesis is order of time spent swim, bike, run.
Total Time 2007 = 95 hours (27, 31, 37)
Total Time 2008 = 253.5 hours (80, 89.5, 84 )
Total Time 2009 = 201 hours (93, 83, 25)
Total Time 2010 = 236.5 hours (89.5, 106, 41)
Total Time 2011 = 228.5 hours (78, 102.5, 48)
Total Time 2012 = 189 hours (77, 69, 43)
Total Time 2013 = 188.5 hours (77, 68, 43.5)
Interestingly, my time spent this year and last year are almost identical, but last year I thought I had a much worse year running, and racing overall.  I definitely put in more running effort, harder run workouts, this year than last year.  My time spent on the bike has dropped dramatically in the last two years.  I really, really need to fix that.  Bike time in 2010 was so high because I did two half-IMs.  I think my total time, swimming, biking, running, and strength will be greater for 2013 than in 2012.  I am swimming more in Oct-Dec than I did last year and doing more strength.  I don't know if I will ever get back to the levels of 2008. 
I will have another post at the beginning of 2014 that compares total training time each year to my performance for those years.


Saturday, October 12, 2013

2013 Transition Pictures

Here are pics of all my transitions from 2013.  Try to do this every year.  Interesting to see all the different setups from this year.

St. Anthony's Triathlon


Gear West Duathlon


Manitou Sprint Triathlon (Became Duathlon)


Graniteman - Saint Cloud Sprint Triathlon


Lake Waconia Triathlon

Heart of the Lakes Triathlon 

Chisago Lakes Sprint - No Pics, on phone and did not transfer

Graniteman - Big Lake

Lake Marion Sprint Triathlon


Lifetime Maple Grove - Oly Distance


St. Croix Valley - Olympic Distance

Dousman Duathlon


Sunday, October 6, 2013

September 2013 Racing and Training Summary

In September I did one duathlon, Dousman Duathlon, and two Wednesday night Salomon Autumn Trail Series races (http://www.autumntrailseries.com/).  This year they changed the course and lengthened it.  Last year it was a single loop and 3.5 miles, now it is 4.2 miles with two loops.  It is a very hard run, very hard.  Tough hills.  Results for my first two are below. 
9/4 Trail Run - 4.2 miles = 37:00 (8:49/mi)
9/18 Trail Run - 4.2 miles =  36:25 (8:41/mi)
So, in two weeks I was able to drop 35 seconds.  In the first race, I ran the first mile in about 7:30ish, in the second race I ran the first mile in about 8:40ish.  Pacing is the key.
I started strength training in September, only got about an hour in before the end of the month.  I got a little more swimming in this September, when compared to last September.  My run and bike are down.  Last year I did not swim Masters in Oct-Dec.  I just swam on my own, mostly once a week.  This year I am going to swim Masters, but only once or twice a week.  Mostly once a week, until December and then pick it up in January.  I want to do a lot of strength work.  I have been saying that for a number of years, hopefully I can keep it up this year.  I would like to maintain bike and run throughout Oct-Dec.  I want to keep running up, and running hard through October while I am trail running.  In the winter, if I can keep 4+ hours of bike a month, and 4+ hours of run a month, with 4+ hours of swim, and at least a couple of hours of strength, that would be great.
As usual, September comparisons, YTD, and totals and averages since 2007.

Year-to-Year Comparison of Septembers


Totals and Averages Since 2007


YTD Totals and Totals Since 2007