Monday, December 31, 2012

December 2012 Racing and Training Summary and 2012 Summary

This December I had one of the highest for biking and running, for the two combined it was the highest of any December.  This is exactly what I wanted to do.  I did alot of work at a high intensity, which is something else I wanted to do.  Jackie and I attended the LA Fitness Sunday morning spin group, and that was a very good workout.  I went in with some doubts, but it proves to be a very good workout.  The guy who runs the workout does a good job and is not too obnoxious.  I barely swam this December, which is fine, because I substituted with strength, which is what I wanted to do.  I will start Masters swimming again in Jan and hope to continue with strength work.
The "other" in the table is 30 minutes of elliptical.
We also did a "Boot Camp" workout at LA Fitness and that really kicked my ass.  A totally different kind of workout that I should do more often.  It is a mix of cardio work and strength, using body weight and small hand weights.  Most of the workout is done in place and you go from one exercise to the next in rapid succession. 
Below all my usual workout data tables is the comparison of 2012 to previous years.

Comparison of Decembers from Year-to-Year


Totals Since 2007 and Averages


Year-to-Date and Totals Since 2007
 
Comparison of Year-to-Year Totals
My year-to-year totals for swimming and biking were the lowest since 2007, running was pretty close to last year.  Running has been pretty similar the last 3 years.  As I have mentioned in previous posts, I don't think I need to increase time too much, would just like to keep intensity up.  I would like to see my swim about 90 hours, bike around 100 hours, and run above 60 hours.  While maintaining high intensity.  I am happy with my strength time and hope to continue to maintain into June, typically I quit strength in April or early May. 
In a few weeks I will put a post for my 2013 goals.  Overall, I am happy with what I have done this year, it might not be my best year, but I did a lot and worked pretty hard, which is what counts.  Now, on to 2013!

Thursday, December 20, 2012

Race Totals Since 2006 (154 Races) and More Statistics

Below is a table with my race totals since 2006.  All races, running, TTs, triathlons, duathlons, and a little cyclecross.


Since 2006, I have raced a combined total of 154 times pretty decent amount considering my injury in 2009.
26 Duathlons
58 Triathlons (Since 2007)
38 Time Trials (32 of them Tuesday Night Time Trials)
28 Running Races (15 of them are 5K)
and 4 Cyclecross races
2008 was the most with 29 races total and 2012 was the least, non-injured, with 20.
 
I put together a table with hours and miles spent racing.  This combines all the race data I have, except cyclecross because I did not keep track of time or distance.


I also included my average pace, just divided the distance by the time.  Actually looks pretty good.
Just for fun, I used the average paces and applied them to an Ironman distance race to see what my time could be, it would be about 10.5 hours.  I have no desire to do an IM, and that calculation is not applicable, but I was just curious.
 
In my spreadsheet, I keep racing and training data together.  With the data above I can see the percentage of time spent racing compared total time, total training and racing.
Percent time Swimming = 3.7%, so I spend 96.4% of my time training to race the swim.
Percent time Biking = 18.4%, so I spend 81.6% of my time training to race the bike.
Percent time Running = 23.5%, so I spend 76.5% of my time to race the run.
Percent total time = 14.2%, so I spend 85.8% of my time training to race.
The running and biking is not entirely accurate since I did not keep track in 2006, but probably close enough.  I would like to increase my percentages for biking and running over the next few years, and decrease swimming.
 
Interesting to see how much total time spent swimming, compared to the amount of time is spent in a race swimming.  I have spent close to 575 hours swimming since 2007, but a total of 19.5 hours of race time swimming.  The bike and run make sense, compared to how much time is spend racing those two.
 
It is really interesting, and kind of fun, to break this data down and look at it.  There is a certain amount of satisfaction in looking at what has been accomplished and how it breaks down.  Data is fun.  Right?


Wednesday, December 12, 2012

Analysis of Swim Performance Since 2007 - Comparison of Performance to Training

I (re)started swimming in 2007, after not swimming since high school. I did duathlons in 2006 and then decided to try triathlons in 2007, so I started swimming in March 2007.  I have undoubtly gotten faster.  I hired a coach in 2008 and got swimworkouts that I did on my own, typically 3 days a week. I started Masters in early 2009, typically 3 days a week.  You can see significant yardage jumps from 2007 to 2008, and I have more or less maintained that yardage since then.  Something of a spike in 2009 and 2010, when I swam more due to my stress fracture.
I have shown improvement with time, but more or less flattened out.  Since the swim distance on swim courses is somewhat suspect, it is hard to determine really how fast you are going.  The only true test of improvement and how fast you are is in the pool, with a certified distance and controlled conditions.  Some swims have the timing mat immediately out of the water, some you have a decent run up before you get to it, so that is included in your time. 
I do know that when I started, it was 2+ minutes for a 100s in a set.  Now I am more in the area of 1:30, sometimes faster. 
I do not think I need to add yardage to get faster.  I think I do plenty of yardage for the distances I race.  To get faster I think I need to do more intensity and probably get a stroke coach.  I know that I require improvements to my stroke.  I drop my left arm, and my entry can get sloppy.  I try to work on those things, but I think it will take coaching for me to really improve my stroke.
Below is the data table.  My times in the table and the charts are in seconds/100yards because it is easier to plot.  The unusually fast time in 2011 is the Twin Cities Triathlon swim in the Mississippi.  In 2009, I only did two races, the reason for the narrow range, one was a relay and one was a sprint, where I walked the run.
I think the data plots really display the change in yardage, and time, and the change in my average pace.  There is a huge jump in yardage and time, and my drop in pace, and then everything is clustered at the end.  This is probably a good indicator that I need to change my intensity and/or stroke, since my improvement has leveled off.  It seems to be the same trend as my run and bike, I don't really need to do more, I just need to do more intensity and do it better.
My fastest times, are probably the 1:24/100yards - 1:29/100yards.
I have said it once, I have said it a thousand times, and I will say it again.  As a beginning triathlete, the best thing you can do is swim a lot and get conditioned in the swim.  I have heard/seen, so many beginning triathletes say they will just "get through the swim", barely do any swim training, do all bike and run, and then get to race day and have a bad/horrible swim, and up having the rest of the race be difficult because of it.  When the swim is comfortable, in the sense you can do it and it is not stressful, and you are conditioned for it, the whole race is "easier".

Swim Data Table


Comparison of Total Hours Swimming to Average Swim Pace for that Year 


Comparison of Total Yards Swam to Average Swim Pace for that Year


Sunday, December 2, 2012

November 2012 Racing and Training Summary

When I type this it is the second of December and I have done 8 workouts in 7 days.  3 bike, 2 run, 2 strength, and 1 swim.  I plan on not taking a rest day for another few days.  My off season has been pretty aggressive.  More aggressive than I thought it would be.  I have not put in as much time as in the past, but I have been putting in speed.
I thought I would take it a little easier, in terms of swimming and total time, I have not put in as much as previous years, for this time of year, but I am putting in the effort. 
Not much to say about the workouts this month, I have put in more strength, which is what I planned to do.  My strength workouts always consist of some core and back, then it is either some arm or leg work, or a little of both.  Basically, I do what I feel like doing when I am doing strength work.  Mostly,  I have been doing sets of 3x15 or 4x15, I have tried some 12, 6, 3, 1 where I increase the weight with decreasing reps, and then continue doing 1 rep and increasing weight until I cannot lift anymore.
My November run time is the most since 2008 and my bike time is about average.  I am getting that run time up, which I what I need to know.  Hope to continue in December.
I have start shopping around for new Masters swim program.  I would like to get back to swimming around 25,000 yards a month starting in January.  I am going to go to Facebook and see if I can get some triathletes to recommend me a place.

Comparison of Novembers from Year-to-Year

 
Totals and Averages Since 2007
YTD Total and Totals Since 2007


Thursday, November 29, 2012

Analysis of Run Performance Since 2006 - Comparison of Training Time to Run Performance

This post is a look at my run data since 2006.  Unfortunately, like the bike, I only have full run data from 2007, only results from 2006.  In 2009, as I have mentioned in the past, I had a bad stress fracture and basically did not run for 6 months of that year, and the beginning of 2010.  So,I have no data for 2009.
Since 2009, I have been hesitant to run as much or as hard as I did prior to the stress fracture.  I am sure that this is part of the reason for my slower times since 2008. 
Near the end of 2012, currently, I have begun to do my training faster, and I plan on running longer training workouts in 2013.  I think I am getting over my fear of re-injuring my leg.  I have been hesitant in training to go as faster or as far as I require to go faster.
So the plan is to go longer and faster in 2013, with the hope I can improve my run speed to 2008 times, or faster results.  In 2008, I ran my fastest 5K (22:33 = 7:16min/mi), 10K (46:36 = 7:31min/mi), 2mi (12:58 = 6:29min/mi), and 8K (36:40 = 7:20min/mi), in 2009 before stopping due to stress fracture.  I have not been close to those times since then.  I have not run an open 10K since 2008, which is something I need to start doing again.
In 2008, for the period of Jan-Sept I put in 86+ hours of running. Since then I have not even come close to that amount of time.  Unlike the bike, where I think I do not need to put in that much more time, just more effort, with the run I think I need more time and effort to show the improvement I am looking to obtain.
2006 is heavily weighted with open runs (11) and duathlons (5).  I have done less and less open runs since then and more and more duathlons and triathlons.  I should really get back to doing more open runs.
The larger range in 2008 is due to my slow run time at Alcatraz and the 70.3 I did that year.  The large range in 2010 is due to the two half-IMs I did.  My average in 2010 is depressed due to the fact I took it easier in the first few races of the year as I came back from injury. In 2011 and 2012 I did only sprint and olympic distance, so the shorter distances kept the range tighter
The data in the table and graphs is in Seconds/Mile, rather than Minutes/Mile because it is easier to graph in Excel.
The graph of comparing total training time to fastest speed and average speed shows no real corollation between the two.
Based on the graph comparing total run time to fastest and average, an argument can be made that more time is better.  The problem is one data point is at the high end and the rest are at the low end.  Hopefully, in 2013 I can put a data point closer to the higher end, at least between the high data point and the low data point, and that data point has a faster average and faster fastest than the rest.
It is too bad that I cannot get a quantative measure of run effort, like power, and plot that, it would be more useful to include with time.


Run Data Table


Comparison of Run Training Time to Fastest Run Speed


Comparison of Run Training Time to Average Run Speed
 
 
Comparison of Total Training Time to Fastest Run Speed


Comparison of Total Training Time to Average Run Speed
 

Tuesday, November 20, 2012

Analysis of Bike Performance Since 2006 - Comparing Bike Speed to Training Time

This is the first of three posts were I will compare my training time, and yardage in the case of swimming, to my performance.  One post for each discipline of swimming, biking, and running.

I have compiled my bike data since 2007, to look at my performance compared to my training time.  I have results for 2006, but no training data.  I did not start tracking training data until 2007, which is unfortunate, since it would be nice to have training data from the start to compare performance data from the start.  The total training time and the total bike time are taken for Jan-Sept of the year.  I used this period because I felt it was the most important part of the year, and typically Oct-Dec I don't race and I take it a little easy.

I compiled all the bike speed data (TT, triathlon, and duathlon) and put that in a table with bike training time data and total training time data.  Click on the table enlarge. 

Bike Data Table


My slowest bike speed for any given year does not vary much from year-to-year. Slowest time, 2008, was from Escape from Alcatraz, very steep, hilly course. Also, I was probably doing too much sight-seeing while riding. In reality, my bike data does not vary much from year-to-year, it is pretty flat. If you throw out my slowest from 2008 and take my next slowest, my range would be about 3mph for each year, except 2006 and 2008.
In 2006, my average bike speed is about 19MPH. I basically flattened out after 2008, averaging about 21.5MPH.  After my injury in 2009, I also stopped paying for a coach in that year, I have not shown much improvement since then.  I improved from 2006 to 2008. During that time the volume and intensity went up dramatically.
If you look at the data, I can train about 70 hours over the 9 month period, at the effort I am putting in, and stay consistent.  I am guessing I need to add more effort, and maybe a little more time, to better my performance.
Also note, in 2006 I was riding a Lemond Sarthe road bike with clip-on aero bars and no race wheels.  Starting in 2007, I raced with a tri-bike and race wheels.  Also, 2006 is duathlons and TTs.

Select any of the tables below to enlarge. 

Total Bike Training Time Compared to Average Bike Speed


Total Bike Training Time Compared to Fastest Bike Speed


Total Training Time Compared to Average Bike Speed


Total Training Time Compared to Fastest Bike Speed


When comparing my total training time, or bike training time, to average or fastest, the data points trend the same.  So, no real correlation between the two, or they are directly correlated, but there does not appear to be a negative correlation between my total training time and bike speed.
If you throw out 2009, then you see the fastest and highest average, which are about the same for each year, occur with over 70 hours of training.  So, I will just say, based on this data, 70 hours of bike training a year is a minimum.
As long as I am doing only duathlons, sprint triathlons, and olympic distance triathlons I can stick to the 70-100 hours.  If I do a 70.3, or longer (IM not going to happen), I would need to increase my training time.  To improve my speed, I will have to, have to, increase my output.  I will have to train harder, not longer.  I know over the last two years I have not put as much effort into training, even though I have put in the time. So, to improve that max speed and average speed I need to train harder.  It has been said many times, "You need to train faster to go faster".  This is something we all know, and I know, it just needs to be put into action.

Saturday, November 3, 2012

October 2012 Racing and Training Summary

My plan is to do less swimming Oct-Dec, but I would like to keep up a decent amount of bike and run.  If not time, then intensity, also I want to add strength.  October has gone pretty much as planned.  I did as much strength work in October as I had done in the previous 9 months.  I mix up my strength when arms and legs, and whenever I do a strength workout I always do core work, because that is where I need it the most.  I have put in a little swimming, which seems like a lot more work since I have basically cut back to once a week for half an hour.  Sometimes that half an hour has seemed really tough.  My run and bike are good, with my run intensity kicked up a bit.  My plan is to take it a little easy this Oct-Dec, and then try to ramp Jan - May of next year better than I did this year.  See if I can do that.

I did something in October that I did not plan on doing, and I am happy I did it.  I did the last two runs, of four total, of the Salomon Autumn Trail Series (http://www.autumntrailseries.com/).  The races are at Hyland Park in Bloomington.  The race starts on the south end of the park, in the Quality Bike Parts parking lot.  The course is a great mix of flats and hills, grass, hard pack dirt, and pavement through the trees of the park.  I am definitely doing this next year, hopefully all four races.  I found out about it through a FB friend's facebook post.  Here are my times for the two 3.54 mile races.  I guess if I set a goal for next year, which I may or may not do, it would be to go under 8 minute miles.

10/3/2012 - 3.54 miles = 30:29 (8:37/mile)
10/17/2012 - 3.54 miles = 30:16 (8:33/mile)


Comparison of Year-to-Year October


Totals and Average since 2007


YTD Total and Total Since 2007
 

Saturday, October 27, 2012

Product Review 26 - Blue-Seventy Axis Wetsuit and Some Swim Analysis With and Without Wetsuit

I have not done a product review in a long time, so I thought I would review the wetsuit I bought in 2011, did not use it much in 2011, but I used it a lot more in 2012.  The wetsuit I bought was a Blue Seventy Axis wetsuit.  Additionally, over the last year, I did some 1000 yard TTs, in the pool, both with and without the wetsuit and I thought I would share that data.

I have owned 2 wetsuits prior to the Axis wetsuit.  Both were QR wetsuits.  My first wetsuit was a UltraJohn and my second wetsuit was a Hydrofull.  The UltraJohn was inexpensive and a good wetsuit if you have never worn a wetsuit and just starting in triathlon.  The Hydrofull seemed great\good at first.  The problem with the Hydrofull, after a few uses, was that it seemed too big in my shoulders and arms, and the rest of the wetsuit fit fine.  It felt awkward because of the upper body portion of the wetsuit was too large.  The Axis wetsuit fit right everywhere, and has continued to fit well.  It is tight, but in the way a tri wetsuit should be tight.  Also, the Hydrofull developed a tear in the crotch early on, the Axis appears to be a much "tougher" wetsuit.  In 2012, I think  I wore the Axis in every race, and there were no issues.  The only thing I think I will do in the future is cut the leg bottoms so they do not go down to my ankles.  I will probably cut up to my calves, so that it is easier to get on and off.   I am very happy I bought this wetsuit and replaced my old QR.  This is a much better wetsuit.


On to some swim time comparisons for wetsuit and non-wetsuit.  The debate over whether wetsuits actually improve swim times should be over, they do help you go faster.  The best way to compare non-wetsuit swim times to wetsuit swim times is by using pool times.  Open water distance is difficult because getting the exact distance each time is difficult and makes a true comparison difficult.  I used 1000 yard TTs to compare non-wetsuit and wetsuit swim times.  I have a number of non-wetsuit swim times and then during the same week I swam the 1000 yard TTs with and without wetsuit, and swim cap.

No wetstuit 1000 yard TT - 12/19/2011 = 15:47  (1:35/100yards)
No wetstuit 1000 yard TT - 1/16/2012 = 15:55  (1:36/100yards)
No wetstuit 1000 yard TT - 1/20/2012 = 15:27  (1:33/100yards)

No wetstuit 1000 yard TT - 2/13/2012 = 15:29 (1:33/100yards)
Wetstuit 1000 yard TT - 2/15/2012 = 13:58 (1:24/100yards)

Wetstuit 1000 yard TT - 3/14/2012 = 14:22 (1:26/100yards)
No wetstuit 1000 yard TT - 3/16/2012 = 15:32 (1:33/100yards)

No wetstuit 1000 yard TT - 7/18/2012 = 15:10 (1:31/100yards)

Fastest time without wetsuit = 15:10 (1:31/100yards)
Fastet time with wetsuit = 13:58 (1:24/100yards)

Comparing fastest to fastest, I am 7 seconds faster per 100 yards with the wetsuit.  Compare slowest to slowest, I am 10 seconds faster per 100 yards with the wetsuit.

My slowest non-wetsuit time was in Jan and was 15:55 and my fastest was July at 15:10, it was nice to see a 45 second improvement in the pool with no wetsuit.

I am definitely faster in a wetsuit.  I think that most people would agree they are too.

I have heard people argue that they are slower without a wetsuit, but can get through transition faster.  In other words Swim + T1 with wetsuit is slower than Swim + T1 without wetsuit.  Even if this is the case, the wetsuit can be an energy saving device.  The wetsuit, because it is slicker through the water and increases buoyancy, means that you have to put less effort into the swim, which can be beneficial to a better bike and run.  The less hard you have to work on one leg, the better off you can be in another.  That being said, practice getting out of your wetsuit to improve T1, that way you can gain time all the way around.

I know these topics have been covered over and over again, but I keep hearing people bring them up.  Whether they are new to triathlon or not, the topic continues to come up.  So, I thought going over it again on my little blog would not be a bad thing.  Since I am bring up stuff that has already been covered, nothing beats getting personalized swim lessons, to improve efficiency, and putting in the yardage

Thursday, October 18, 2012

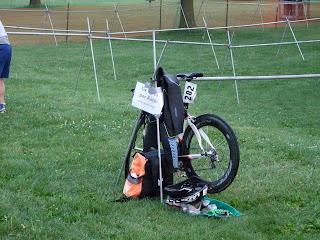
2012 Transition Pictures

Every year I take pictures of my transition setup, this year is no different. Last year was the first year that I posted the pictures.  Below are 1, 2, or 3 pictures from my transition setup for each race in 2012.
Enjoy!


St. Anthony's Triathlon


Gear West Duathlon


Manitou Sprint Triathlon


Lake Minnetonka Triathlon


Lake Waconia Triathlon


MinneMan Triathlon


Heart of the Lakes Triathlon


Chisago Sprint Triathlon


Brewhouse Triathlon


Maple Grove Triathlon


St. Croix Valley Triathlon


Dousman Duathlon