There are bunch of tables and charts below (fun!). Data.
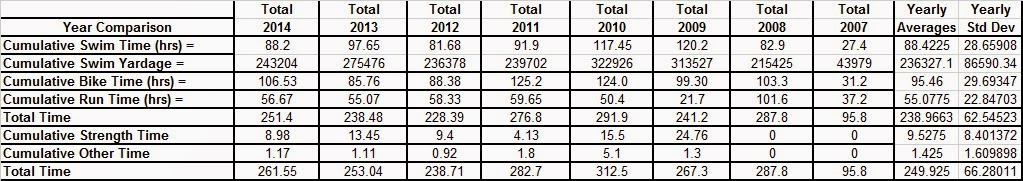
The table below has the totals for swimming, biking, running, strength, and other (other is usually elliptical, maybe some yoga) from year-to-year starting in 2007. 2014 was the most time I spent racing and training since 2011. 2014 had a total of 261.55 hours, compared to last year, 253.04 hours. Swim was down from last year, bike up a lot, run up a little.
There is a chart below with swimming, biking, running, and total time. Charts can be more fun than tables, at least to look at.
Below that chart, is a chart that breaks down all my races, by type (triathlon, duathlon, run, and bike), by month. Not surprising the peak is June, July, and August, with June being the most of the three months.
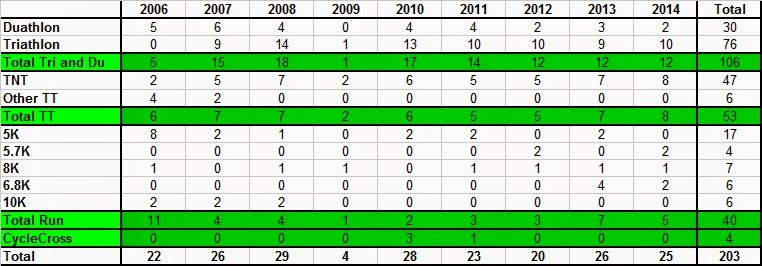
The bottom most table breaks down each race type by year. Since 2006 I finished, I only put in races finished, a total of 203 races, with 106 of those races triathlons (76) and duathlons (30). The number of TTs I have done (53) now surpasses the number of running races I have done (40). My attempt at cyclecross racing is short lived, at 4. Maybe I will go back to cyclecross someday.
I am not sure why I keep track of all this. Who am I kidding, I am sure some of it is OCD. It has some value to me, it shows me where I have been and where I am going and what I have done.
Time Spent Swimming (also Yardage), Biking, Running, Strength, and Other from Year-to-Year


Race Breakdown by Type and Year
The table below has the totals for swimming, biking, running, strength, and other (other is usually elliptical, maybe some yoga) from year-to-year starting in 2007. 2014 was the most time I spent racing and training since 2011. 2014 had a total of 261.55 hours, compared to last year, 253.04 hours. Swim was down from last year, bike up a lot, run up a little.
There is a chart below with swimming, biking, running, and total time. Charts can be more fun than tables, at least to look at.
Below that chart, is a chart that breaks down all my races, by type (triathlon, duathlon, run, and bike), by month. Not surprising the peak is June, July, and August, with June being the most of the three months.
The bottom most table breaks down each race type by year. Since 2006 I finished, I only put in races finished, a total of 203 races, with 106 of those races triathlons (76) and duathlons (30). The number of TTs I have done (53) now surpasses the number of running races I have done (40). My attempt at cyclecross racing is short lived, at 4. Maybe I will go back to cyclecross someday.
I am not sure why I keep track of all this. Who am I kidding, I am sure some of it is OCD. It has some value to me, it shows me where I have been and where I am going and what I have done.
Time Spent Swimming (also Yardage), Biking, Running, Strength, and Other from Year-to-Year
Swimming, Biking, Running and Total Time by Year
Races by Type and by Month
Race Breakdown by Type and Year

No comments:
Post a Comment