The 2012 Tuesday Night Time Trial season is over and I am pretty happy with my overall results. It is my second fastest season. Nothing can compare to my 2008 season, maybe someday I will get back that speed.
The TT is considered the toughest type of race in cycling, because it is the rider against the clock. You go as fast as you can, there is no drafting. It is a true test of fitness and cycling strength and ability.
I would contend the TNT course is one of the most challenging 11 miles you will ride, especially if you are going to do a TT on it. The course is not flat, the hill on the turnaround is a killer. The hill is long and the grade increases as you go. There are shorter steeper hills on the course and there a low grade long runups. There is really no flat section on the course.
The people who ride this are fast, very fast. I will never be competitive on this course, so it is a great training ride for me. It is also a good measure of where I am in terms of my cycling ability. I think TTs are excellent for working on form. They teach, and help you work on form while riding as fast as you can. I also use this race as an opportunity to get in a run after a really hard ride.
The race has been put on for the last 3 years, I think it has been 3 years, by the Twin Cities Spoke of the International Christian Cycling Club. They have done a very, very good job. I will definitely continue to do this race.
Onto results, comparisons, and some thoughts. I started doing the TNT in 2006. I did two that year on my new Lemond Sarthe road bike with clip-on aerobars. I also did a four Black Dog TTs that year. In 2007, I had my tri bike and I did five TNT and two Black Dog. After 2007 I only did TNTs. In 2009 I did only two TNT races due to my stress fracture.
Out of curiousity, let's look at the time I spent cycle training each year from Jan-July, last race is typically in August. In parenthesis is the total time swim, bike, and run training for the same period, and in bold is my average speed for the year and standard deviation. 2006 has two races and 2009 has two races.
Jan-July 2006 Total Cycle Time = I did not log in 2006 - Ave Speed = 19.3MPH and Std Dev = 0.4455MPH)
Jan-July 2007 Total Cycle Time = 26.65 (80.35 hours) - (Ave Speed = 21.46MPH and Std Dev = 0.3474MPH)
Jan-July 2008 Total Cycle Time = 65 hours (194.5 hours) - (Ave Speed = 23.03MPH and Std Dev = 0.3239MPH)
Jan-July 2009 Total Cycle Time (injured season) = 55.8 hours (153.2 hours) - (Ave Speed = 21.49MPH and Std Dev = 0.6239MPH)
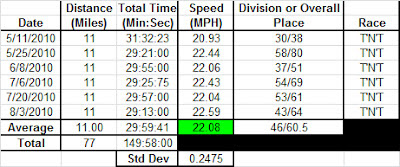
Jan-July 2010 Total Cycle Time = 79.5 hours (175 hours) - (Ave Speed = 22.08MPH and Std Dev = 0.2475MPH)
Jan-July 2011 Total Cycle Time = 82.3 hours (179.6 hours) - (Ave Speed = 22.17MPH and Std Dev = 0.7249MPH)
Jan-July 2012 Total Cycle Time = 55.5 hours (152.7 hours) - (Ave Speed = 22.26MPH and Std Dev = 0.362MPH)
The years where I had my two fastest average speeds are 2012 and 2008, which have some of the least amount of time spent on the bike during the main part of the year. If you look at the standard deviation from 2010 -2012 and look at my average speed, there is actually no real difference in my average speed during that three year period. So there appears to be no correlation between the amount of time I spend on the bike training and my average speed.
There is a large difference between 2008 and other years, about 1MPH. That was the year I was coached and I raced a lot.
I would think that for an 11 mile TT, intensity is more important than time on the bike. This year I have tried to concentrate more on intensity and form. It is very interesting to look at these things and think about any type of correlation they may have. There are so many variables to look at with racing and training. I think that for me to make a large gain in speed I would have to concentrate on improving my form, intensity, and time on the bike. This is kind of a "duh" statement, but it is probably the truth. I think it would help to add more strength work and work with a coach. Not sure any of these things will happen in the future.
At some point I will put my average run times per year against my training time at the run and see how they compare.
Below are the summary tables for each year
2006 TNT Results
2008 TNT Results
2009 TNT Results
2010 TNT Results
2011 TNT Results
2012 TNT Results


1 comment:
I didn't do these this year but am thinking about it for next year. It looks like a lot of fun.
Post a Comment